
Pie charts hand you the percentages. No axis to read, no gridlines to estimate, nothing between the label and the number.
So candidates write the numbers down. Coal was 48%, gas was 22%, nuclear was 18%, renewables were 12%.
That is a legend transcribed into sentences, and it does not pass band 6.
The decision that fixes it comes before any writing: are you looking at one pie chart, or more than one?
One Pie or Several?
The two cases want completely different paragraphs.
One pie chart. You are describing components of a whole at a single moment. Group by magnitude: the dominant slices in one body paragraph, the small and exceptional ones in the other.
Two or more pie charts — the same categories at different dates. Now you are describing change, and there is a specific trap waiting.
Do not give each chart its own paragraph. Describing chart 1 in full and then chart 2 in full “produces no comparative synthesis” — you have written two descriptions and made no comparison, and comparison is what the instructions asked for.
Group by behaviour instead. One paragraph for the categories whose share grew, one for those that shrank or held steady. Each sentence then spans both charts naturally.
The sources are blunt that no single rule covers every pie task. As Liz puts it: “There is no rule or advice for all pie charts. It depends what the pie charts show.” Read yours first.
Pie Chart Structure
- Introduction, about 25 words. Paraphrase the prompt. Name the categories, the place and the dates.
- Overview, about 40 words. Two or three main features. No figures.
- Body one, about 55 words. The dominant slices, or the categories that grew.
- Body two, about 50 words. The minor slices, or the categories that fell.
Write 150 to 170 words. Under 150 is penalised. Over 210 and you are “getting lost in detail instead of focusing on key features”.
The Overview
Two or three features and no numbers.
On one chart, say which category dominates, which is negligible, and whether the distribution is concentrated in one or two slices or spread evenly.
On several charts, say what changed most, what changed least, and whether the ranking at the top swapped. A leader that becomes a minor share is the single most reportable thing on a pie task.
The classic band 6 overview is safe and empty: the charts show changes over time. That tells the examiner nothing they cannot see. Say what actually happened.
The Body Paragraphs
One paragraph per group, and never one paragraph per chart.
Select the figures. Four slices across two charts gives you eight percentages, and an answer that reports all eight has made no decisions. Use the ones that support a claim.
Where a slice is unlabelled or awkward, approximate honestly: approximately, just over, in the region of, close to.
Pie Chart Language
Tenses
- Dates in the past → past simple.
- No dates → present simple. A pie chart with no year describes a general state: “coal accounts for 48% of generation”, not “accounted”.
Proportions and Fractions
This is the vocabulary that carries the whole task type. Repeating “per cent” eight times is accurate and scores nothing on Lexical Resource.
| Figure | Say it as |
|---|---|
| 5% | a small fraction |
| 10% | a tenth, one in ten |
| 15% | less than a fifth |
| 20% | a fifth |
| 25% | a quarter |
| 30% | nearly a third |
| 33% | a third |
| 50% | a half |
| 65% | nearly two-thirds |
| 75% | three quarters |
Vary the noun as well as the number: proportion, share, portion, ratio, fraction, percentage.
And mind the countable rule. Twice as many for things you can count — households, students, vehicles. Twice as much for volume and money.
Describing the Change Between Charts
Where shares move, use real verbs rather than “went up”:
- Growing — rose, climbed, grew, saw an increase, witnessed a rise in popularity
- Shrinking — fell, declined, dropped, dipped, saw a decline
- Holding — remained stable, stayed constant, changed little
One caution. Soared, rocketed and plummeted already carry their intensity, so they cannot take a modifier. “Plummeted gradually” contradicts itself.
How It Is Marked
Four criteria, 25% each. Task Achievement caps most pie chart answers, and the overview is the mechanism.
- Band 5 — “Key features which are selected are not adequately covered. The recounting of detail is mainly mechanical.”
- Band 6 — “Key features which are selected are covered and adequately highlighted. A relevant overview is attempted.”
- Band 7 — “presents a clear overview, the data are appropriately categorised, and main trends or differences are identified.”
Appropriately categorised is the descriptor’s name for the grouping decision. On a multi-chart pie task, grouping by chart rather than by behaviour is precisely what it marks down.
Two penalties land before your English is assessed.
Under-length. The 150-word minimum is counted after copied prompt wording is discounted.
Explaining the data. A pie chart shows shares, not reasons. Writing that renewables grew because of government policy is unsupported content, however plausible.
Pie Chart Sample
An original task in the standard format. Two charts, same categories, so this is the group-by-behaviour case.
The charts below show the sources of electricity generation in one country in 2000 and 2020.
Summarise the information by selecting and reporting the main features, and make comparisons where relevant.
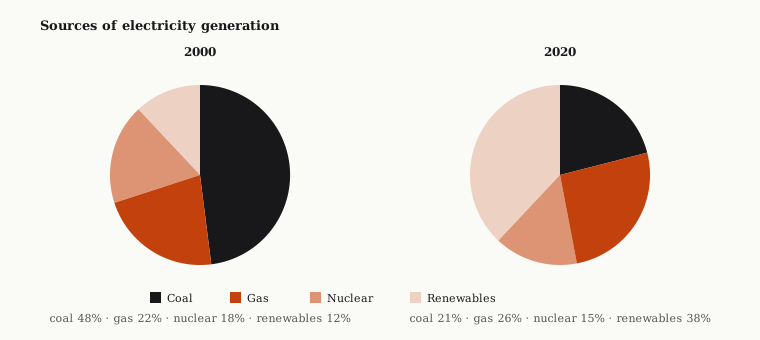
Two categories grew and two shrank, and the largest source at the start is not the largest at the end. That is the answer’s shape, and it cuts across both charts rather than along them.
Band 6 Model Answer
The charts below show the sources of electricity generation in one country in 2000 and 2020. Overall, there were some changes in the sources of electricity between the two years.
In 2000, coal was 48%, gas was 22%, nuclear was 18% and renewables were 12%. Coal was the biggest source of electricity in this year.
In 2020, coal was 21%, gas was 26%, nuclear was 15% and renewables were 38%. Renewables were the biggest source in 2020 and coal was much lower than before.
Every figure is correct. It is still a band 6 answer, and the structure is why: one paragraph per chart, so the comparison never happens inside a sentence.
Band 7 Model Answer
The two charts compare where one country’s electricity came from at the start and end of a twenty-year period.
Overall, the country moved decisively away from coal and towards renewable sources, which replaced coal as the leading supplier. Nuclear and gas changed far less, and together they accounted for a similar share at both dates.
Renewables saw by far the largest shift, climbing from around a tenth of generation to over a third. Gas rose more modestly, from just over a fifth to around a quarter, and the two together supplied the majority of electricity by 2020.
Coal moved in the opposite direction, falling from almost half of all generation to roughly a fifth. Nuclear declined only slightly, from 18% to 15%, making it the most stable source across the period.
Six Differences
The introduction is paraphrased. “Where one country’s electricity came from” replaces the prompt, so all of it counts toward the 150.
The overview names the reversal. Coal out, renewables in, and two sources that barely moved. Three features, no figures.
The body groups by behaviour, not by chart. One paragraph for what grew, one for what fell. Every sentence now spans both years, which is what makes it a comparison rather than two lists.
Proportional language does the work. A tenth, over a third, just over a fifth, almost half. Band 6 says “per cent” eight times.
Figures are selected. Eight percentages exist. Band 7 quotes two exactly and expresses the rest as fractions, because the fractions make the shape clearer than the decimals do.
Stability is reported, not skipped. “The most stable source across the period” is a finding. Band 6 mentions nuclear twice and never says it hardly moved.
Do’s and Don’ts
| Do | Don’t |
|---|---|
| Check how many charts you have before planning | Assume one structure fits every pie task |
| Group by what grew and what fell | Give each chart its own body paragraph |
| Say which category overtook which | Write that the charts “show changes” |
| Use a quarter, a third, nearly two-thirds | Repeat “per cent” in every sentence |
| Use present simple when there are no dates | Default to the past simple out of habit |
| Report what stayed the same | Mention only the categories that moved |
| Quote two or three figures and imply the rest | Report all eight percentages |
| Describe the shares | Explain why they changed |
Practice
Count the charts, then decide the grouping. On a single pie that means dominant against minor; on several it means grew against fell. Everything else follows.
You can check a Task 1 answer with the IELTS writing checker: paste the question and your response for an estimated band. It marks all four criteria separately, so you can see which one is capping your band.
Related: how to describe a bar chart covers comparisons between categories, how to describe a line graph covers change over time, how to describe mixed charts covers a pie chart paired with another visual, and how the writing band scale works explains what each criterion rewards.
Frequently asked questions
- How do I describe two pie charts in IELTS Task 1?
- Do not give each chart its own paragraph. Describing chart one in full and then chart two in full produces no comparative synthesis, and comparison is what the instructions ask for. Group by behaviour instead: one paragraph for the categories whose share grew, one for those that shrank or held steady.
- Should I put percentages in a pie chart overview?
- No. The overview carries two or three main features and no figures at all. The percentages are evidence for the body paragraphs.
- What vocabulary should I use for pie charts?
- Proportional language rather than repeated percentages: a quarter, a third, nearly two-thirds, just over a fifth, almost half. Repeating 'per cent' in every sentence is accurate and scores nothing on Lexical Resource.
- How many words should a pie chart answer be?
- 150 to 170. Under 150 is penalised, counted after copied prompt wording is discounted. Past about 210 words you are getting lost in detail instead of focusing on key features.
- Should I mention a category that barely changed?
- Yes. Stability is a finding, not a gap. Naming a source as the most stable across the period shows you read the whole chart, where a band 6 answer tends to mention it twice without ever saying it hardly moved.
- Can I explain why the shares changed?
- No. A pie chart shows shares, not reasons. Writing that renewables grew because of government policy is unsupported content, however plausible it sounds.